Transforming fragmented cross‑channel data into a scalable system that shortens the learning curve for new users and supports ongoing, complex analysis for enterprise clients.
CONFIDANCE NOTICE
This case study contains information from work completed under non-disclosure agreements. Sensitive details have been modified or omitted to respect confidentiality obligations. The content represents my personal analysis and work contributions, and does not necessarily reflect the views or positions of Whatagraph.
INTRODUCTION

CONTEXT
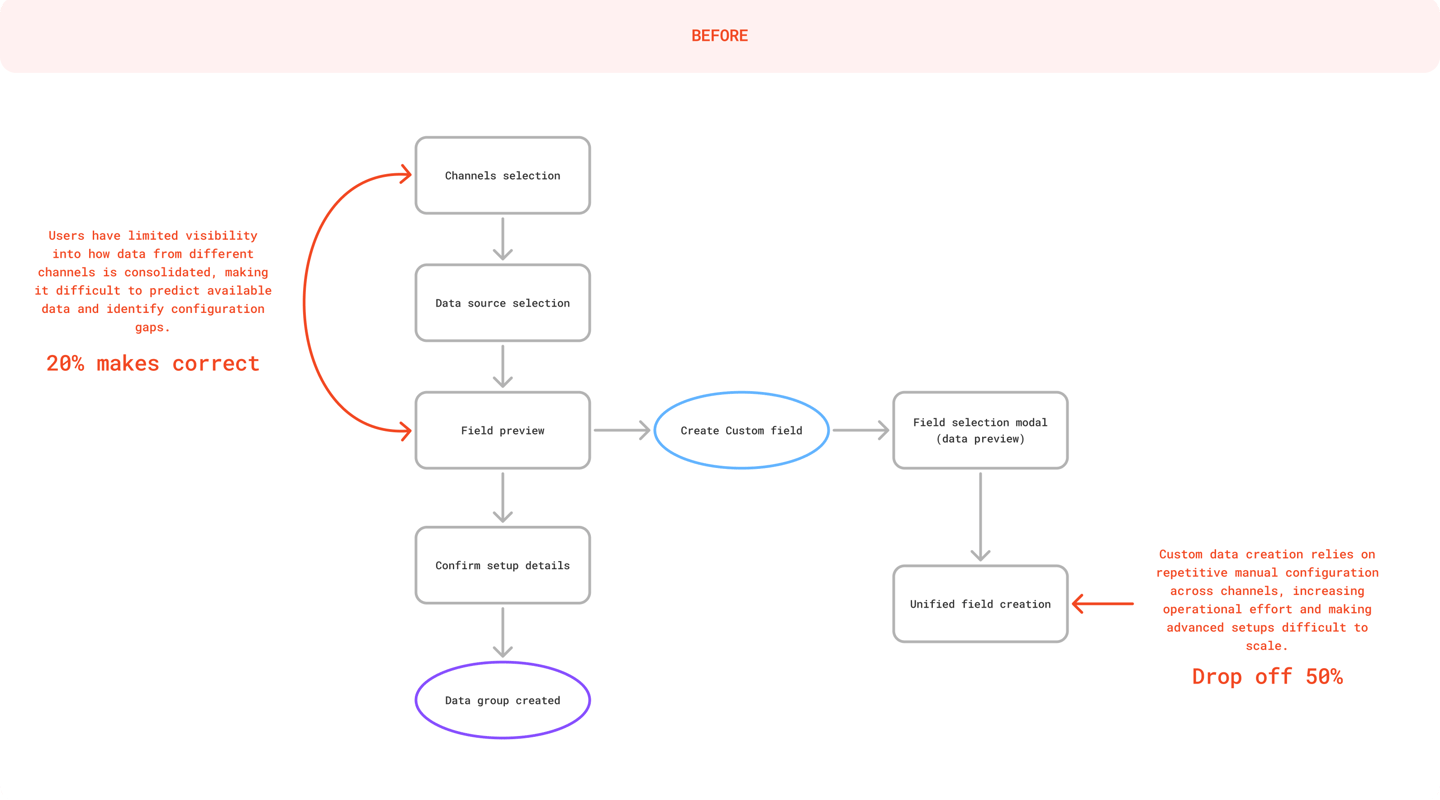
Inconsistent schemas, slow API dependencies, and limited data flexibility constrained data visualization, while the legacy data mixing functionality required repetitive manual setup and was difficult for non-technical users to operate.
To unlock scalable goal tracking, intelligent alerts, AI capabilities, and advanced blended visualization, the data layer required systemic redesign.
IMPACT
MY ROLE
I shaped the product direction and led the end-to-end design of the initiative — from early validation and scoping to final system definition for development.
As the sole designer, I worked closely with the CTO, CPO, and backend engineers to align architectural decisions with business strategy and deliver a scalable foundation for future product growth.


CHALLANGE
OBJECTIVES
01.
02.
03.

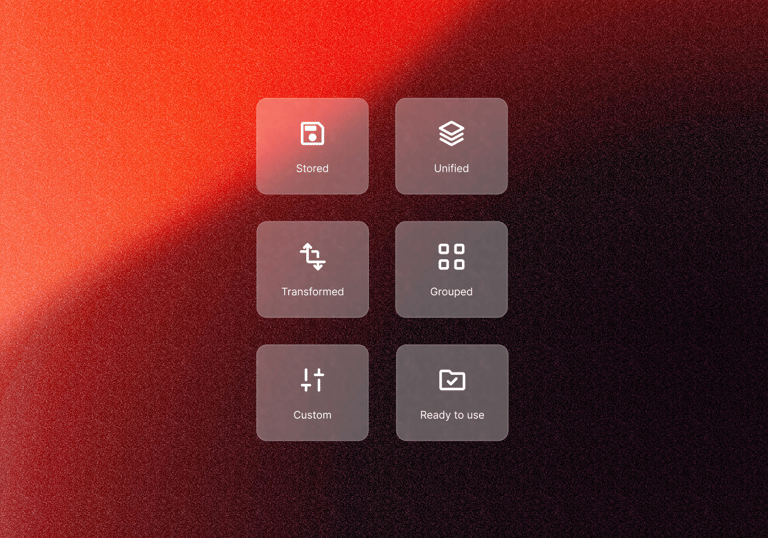
Scalable Data Foundation
To move forward, we restructured how data is organized, combined, and operated across the platform.
Unified Structure
Simplified Combination
Smart Operational Layer


01.
02.
03.
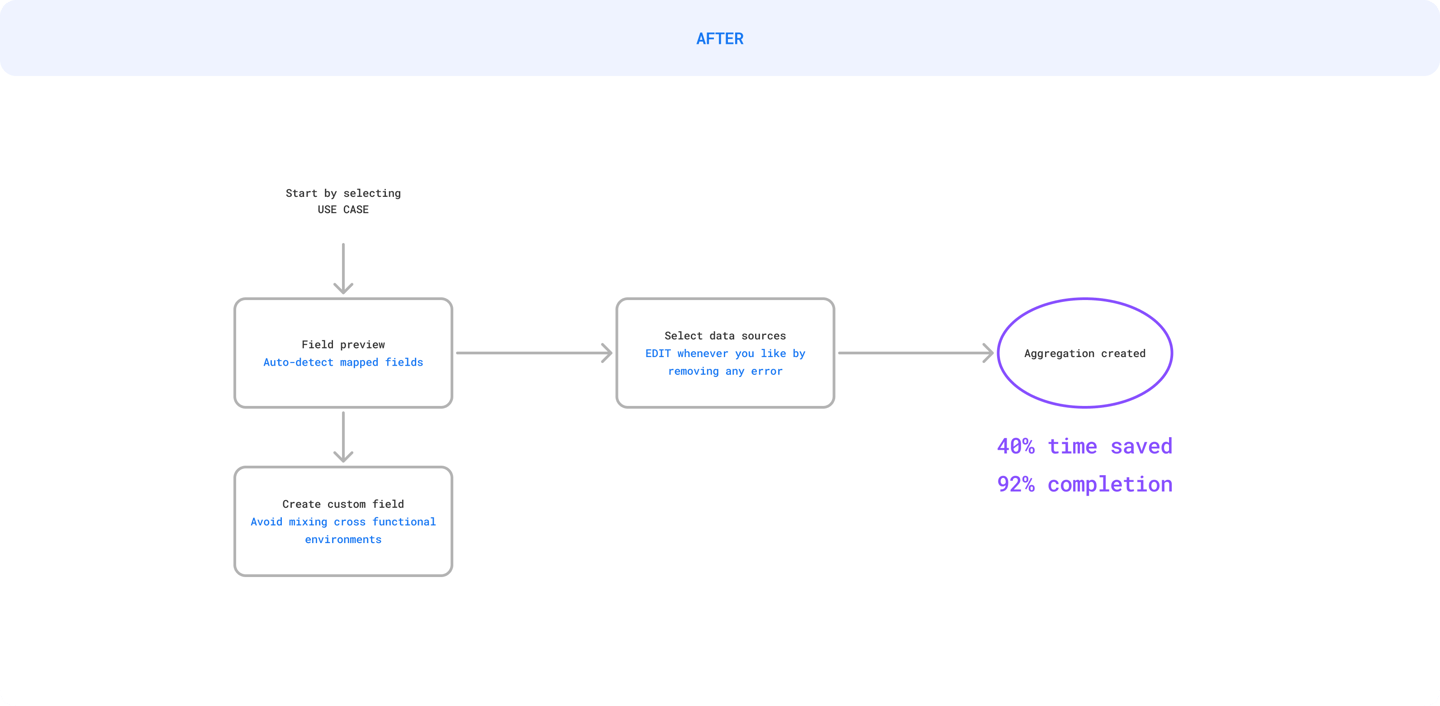
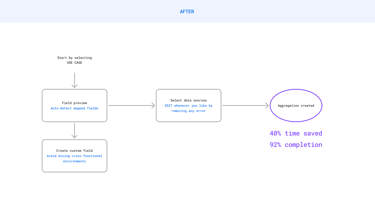
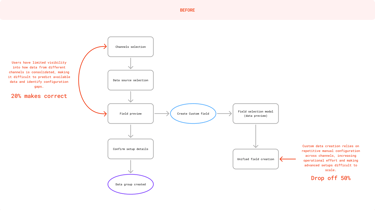
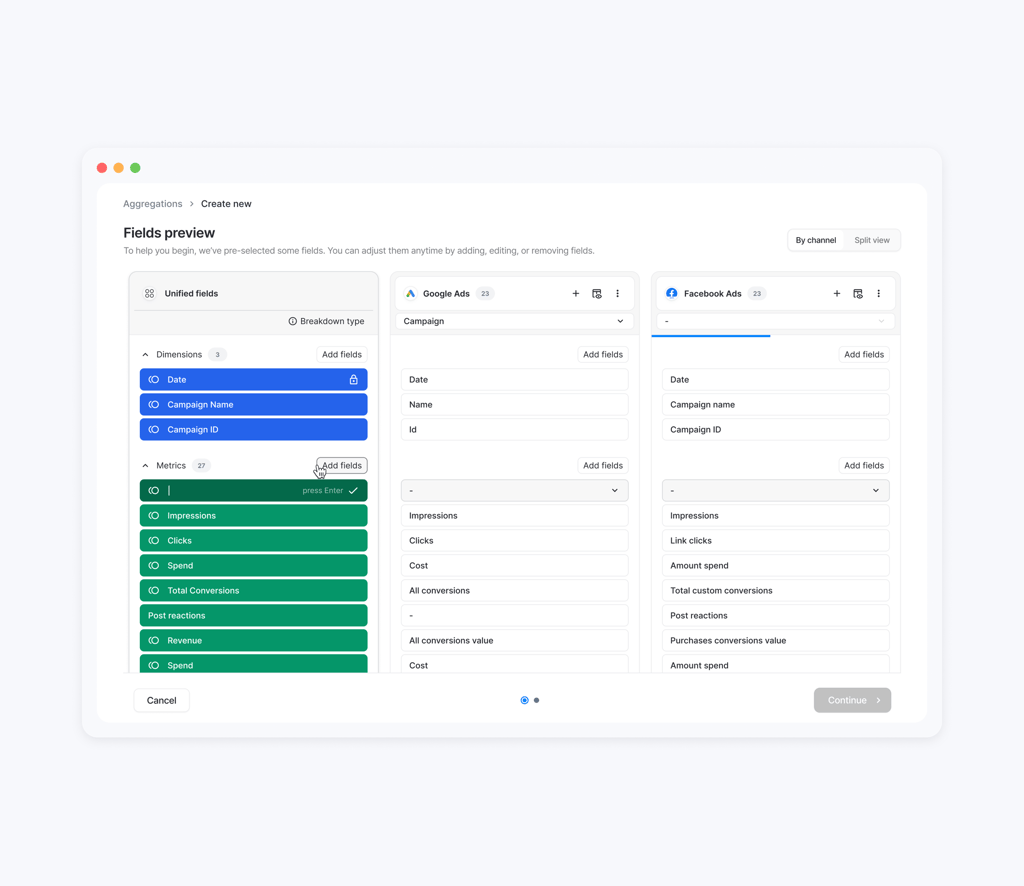
Using insights from interviews, usability testing, and product signals, I reworked the setup flow to be simpler and easier to understand — especially for first-time users.
This helped reduce unnecessary complexity earlier in the experience and created a more guided path into a system that had previously been difficult to approach.
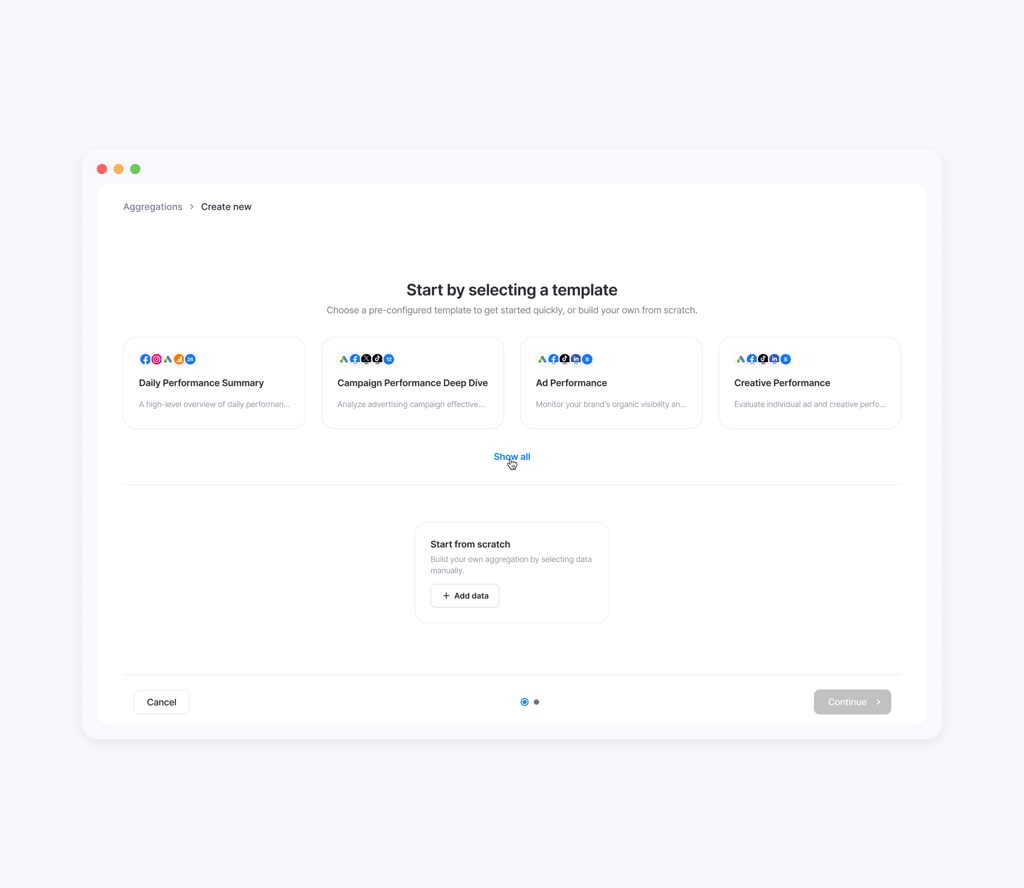


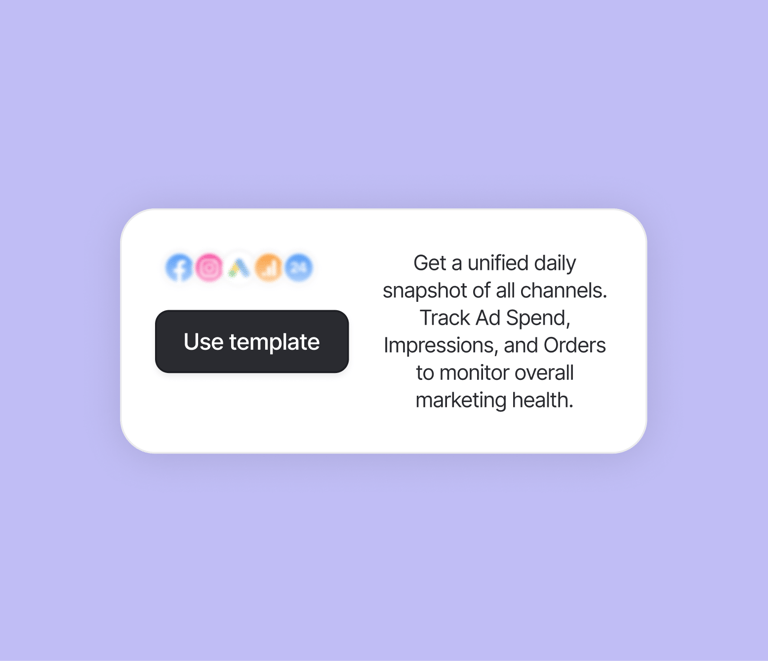
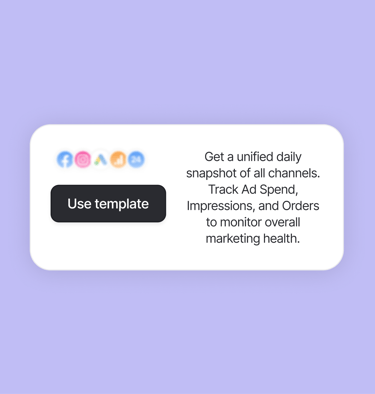
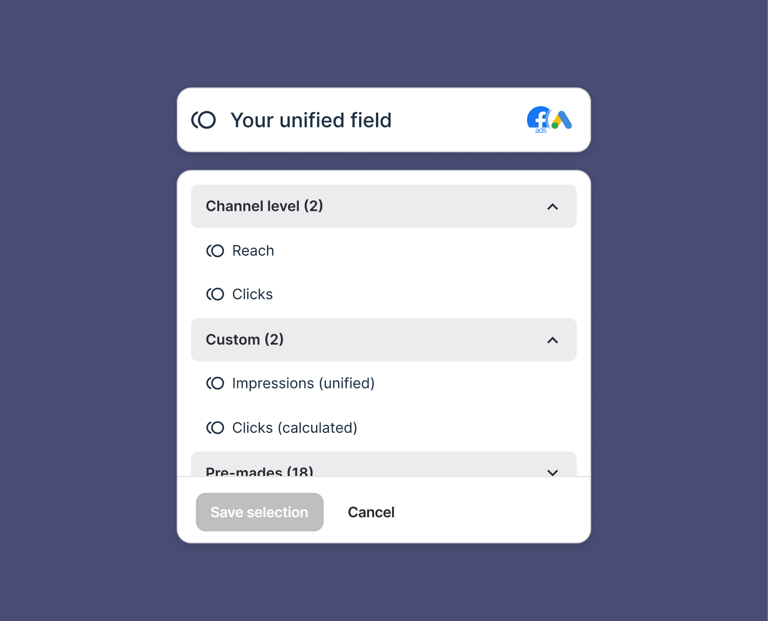
Instead of asking users to build logic from scratch every time, the experience provided a faster way to begin from a clearer structure. This lowered cognitive load, made setup easier to repeat, and helped less technical users get to value faster.


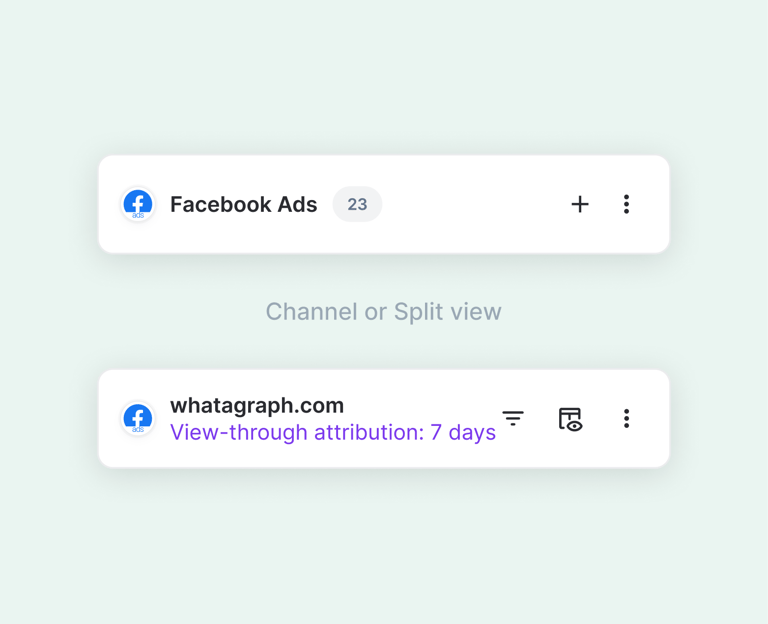
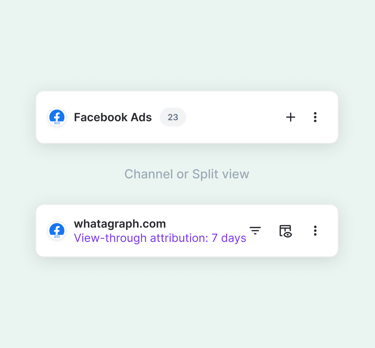
Structured the experience to offer a simpler path for everyday use, while still allowing deeper control when teams needed more flexibility, filtering, or precision. This helped the product serve a broader range of users without forcing everyone into the same level of complexity.


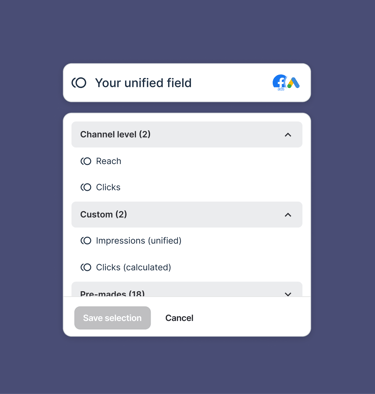
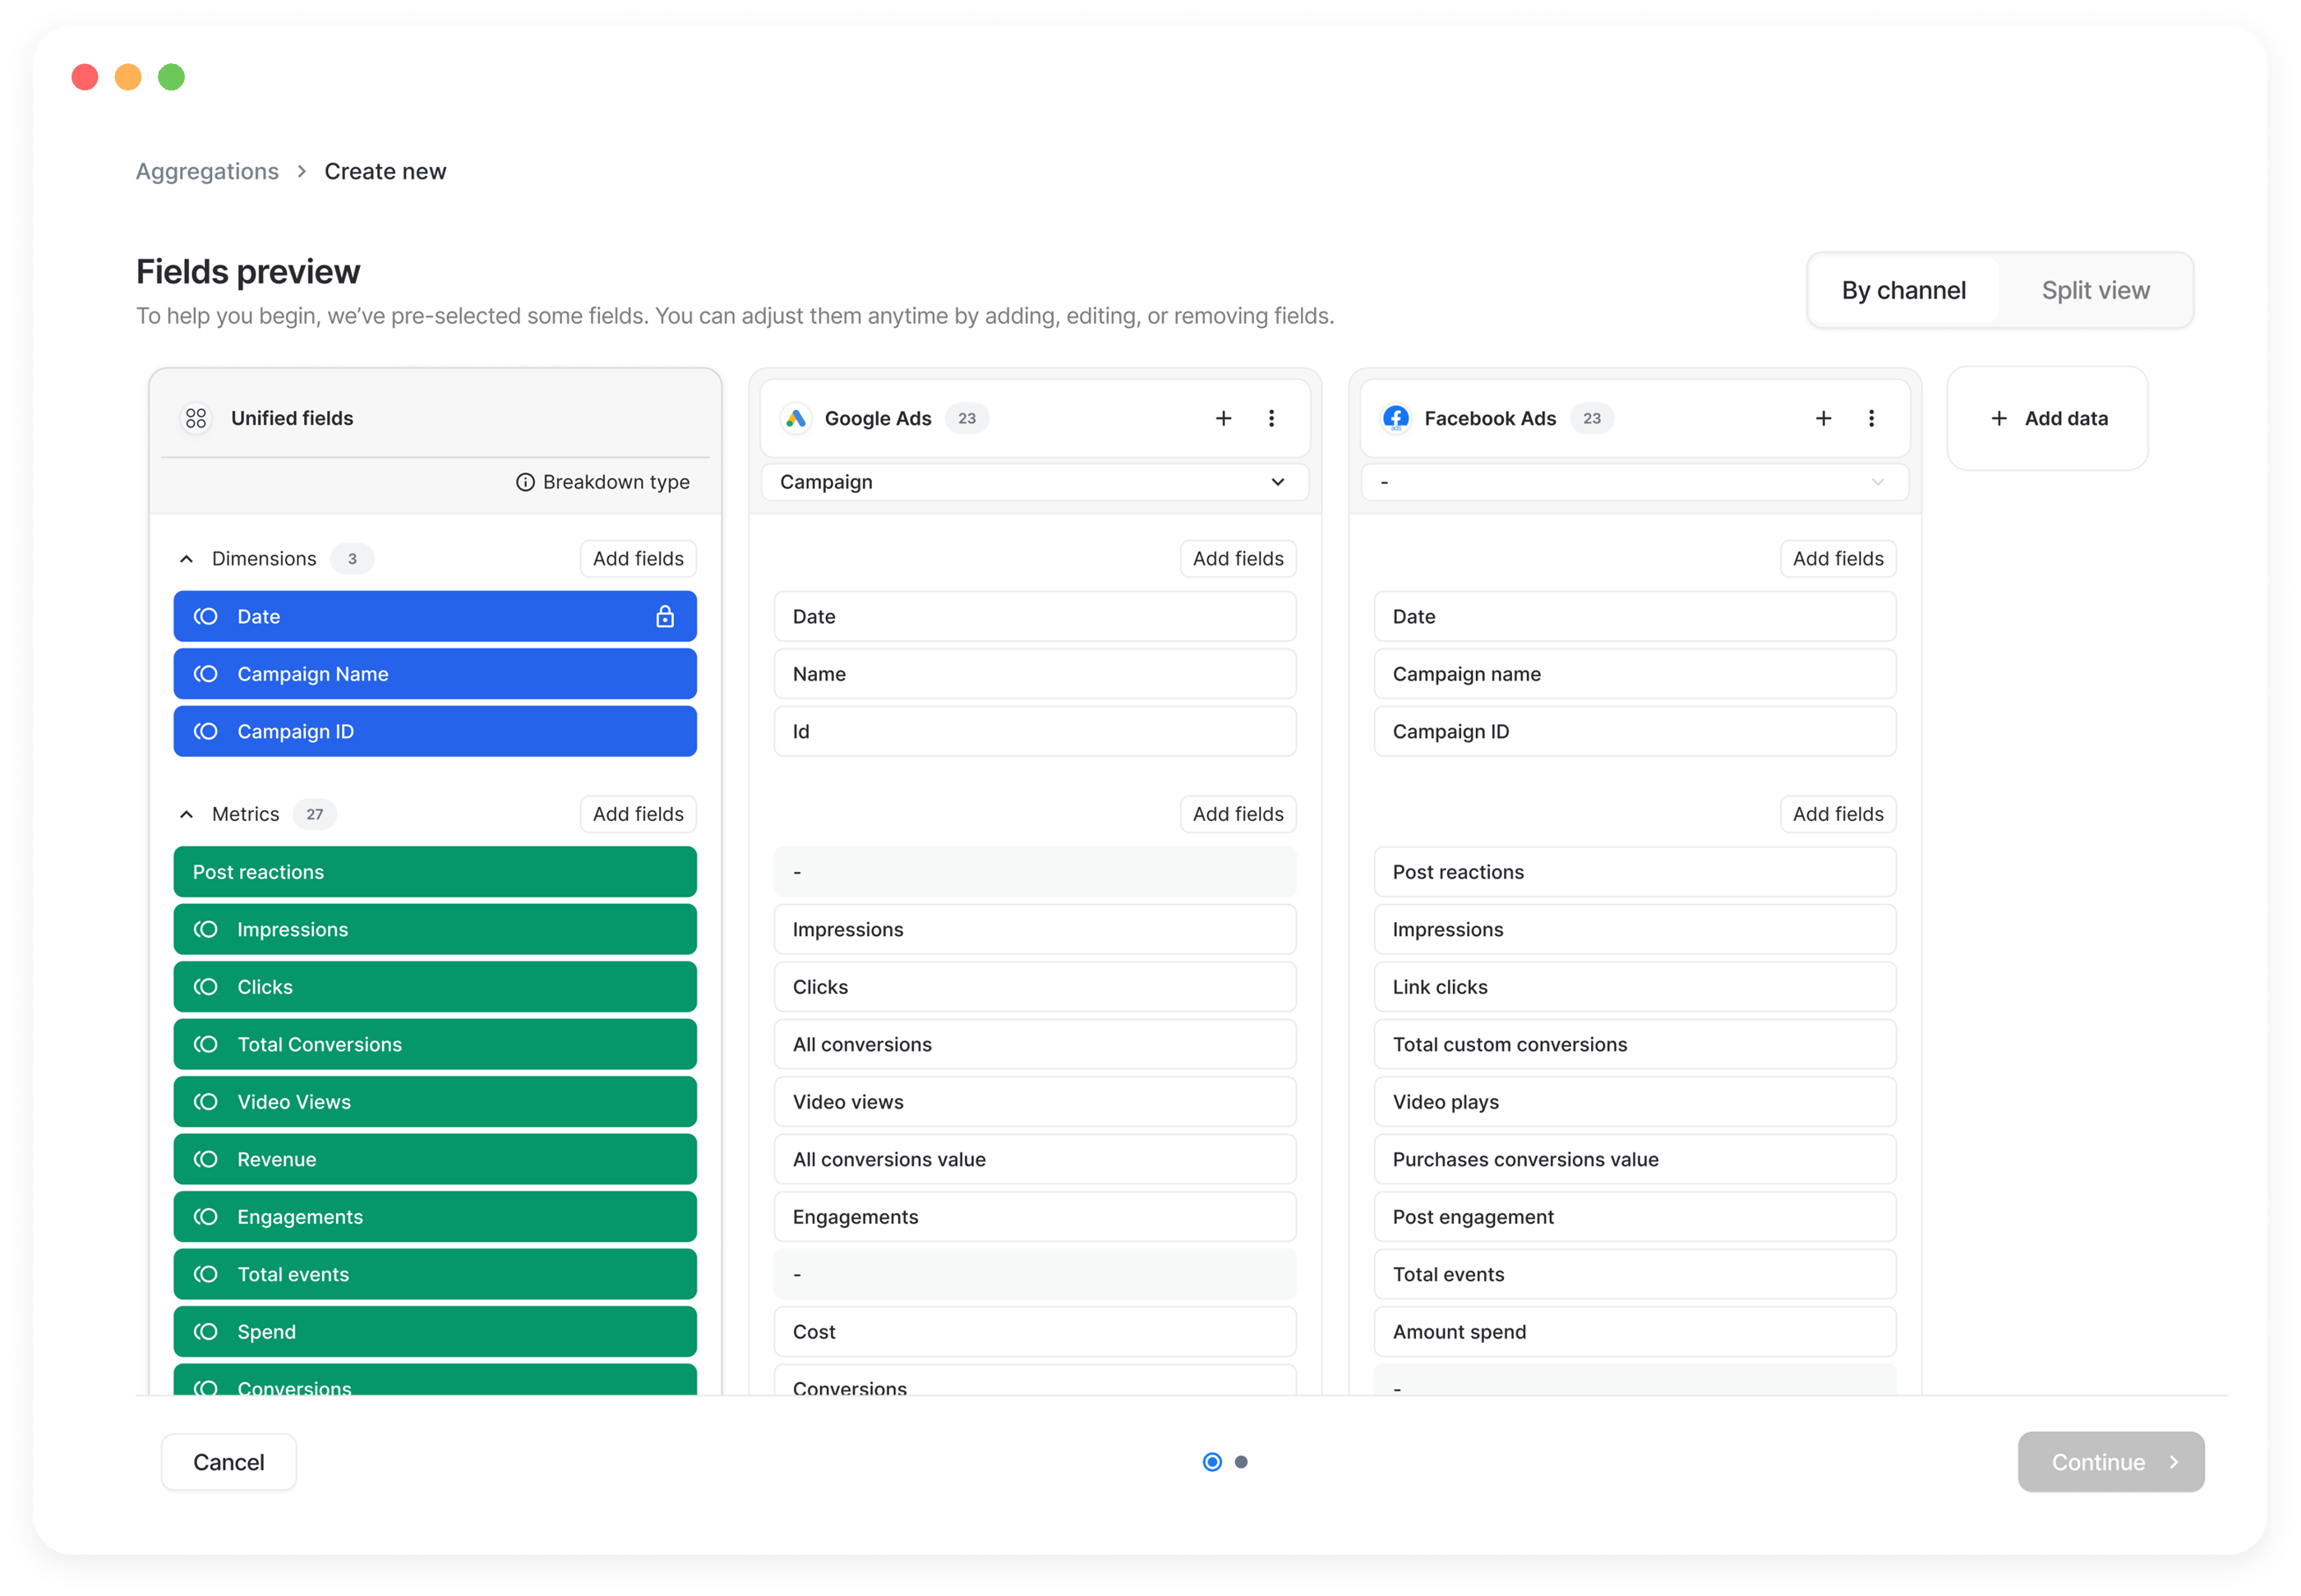
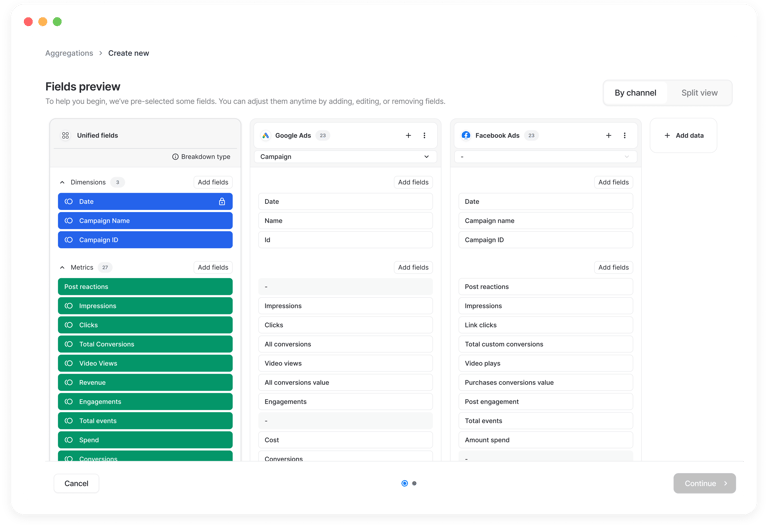
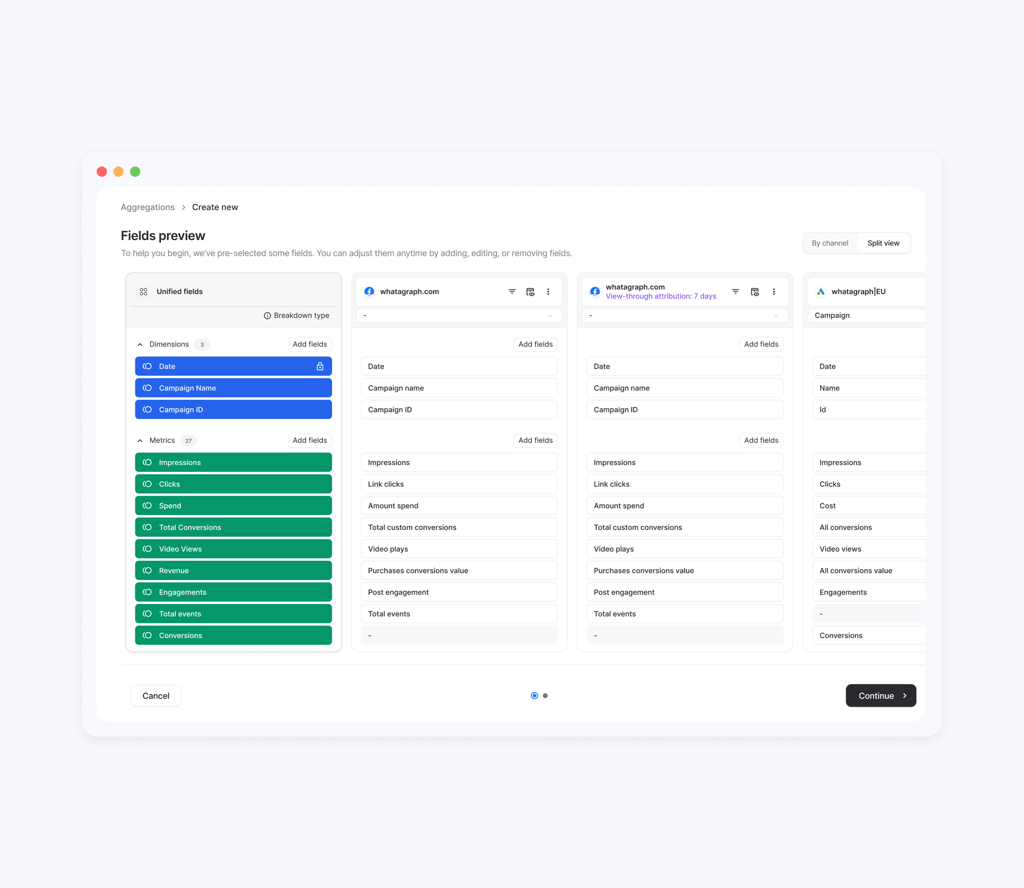
Custom unified field creation previously lived outside the primary workflow, making setup and maintenance harder to manage as complexity increased. Integrating field mapping directly into the flow created a more connected experience, making data structures easier to understand, adapt, and scale.
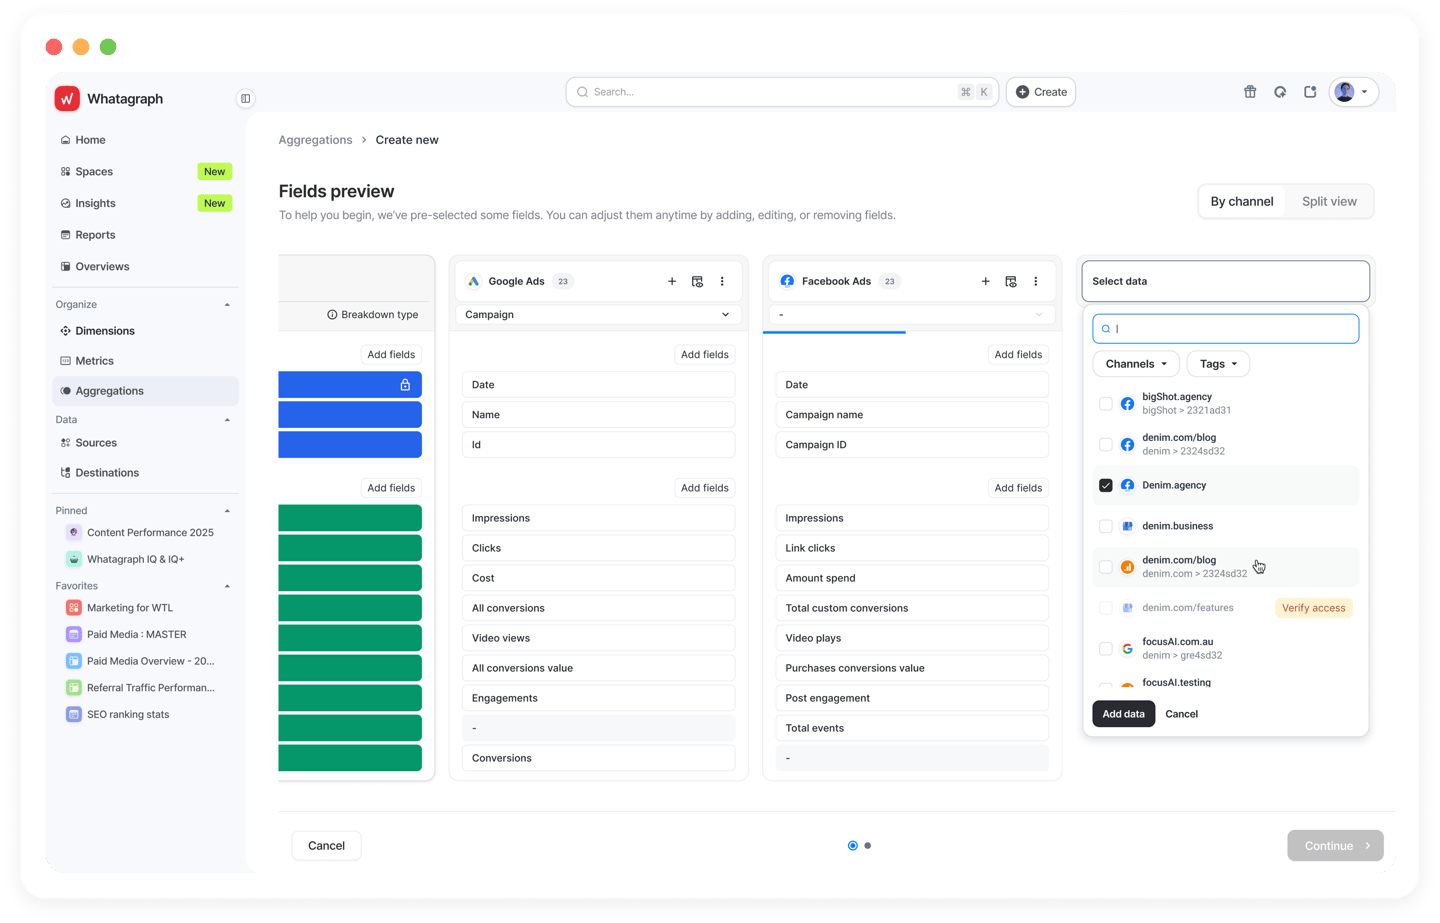
INTRODUCING AGGREGATION BUILDER
OVERALL IMPACT
Reduction in Data Setup Time
Streamlined data preparation and unification, significantly reducing manual effort required to structure and combine data across channels.
40%
60%
Growth in Advanced Metric Usage
Increased adoption of custom metrics and structured data workflows, particularly among high-volume and enterprise accounts.
Let's talk. I'd love to hear from you.
Ovidius Avizienus Design + Product Portfolio
2026